With your Google Analytics account set up, and assuming you took actions to begin generating traffic on your platform to track visitors; you should have data to analyze the performance of your platform. I have shown you in How to Get Started with Google Analytics how the Audience Overview in Google Analytics should look like with populated results.
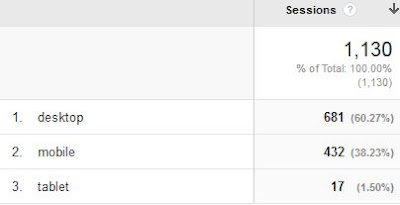
I have been analyzing performance results from RGB Exchange and it is amazing to see how many different performance factors are tracked by a free tool from Google. I am able to track the basic information on the number of sessions, users, page views, bounce rates, etc., which give an overview on how well the website is performing. In addition, I am able to track the users demographics such as their age, gender, language, and country which help to determine the audience the website should be directed towards. I am also able to track the device platform on which the website is accessed from, as seen in the picture below; which help to bring awareness that the majority of the sessions are from desktop computers.
However, an important factor in reviewing performance is to set a date range to get the most relevant information and to track trends. For example, in the picture above the data is from the last 30 days, which gave me an overview of the traffic for the month.While the picture below is data from last week that show a potential trend of an increase in mobile platform usage, bringing awareness to keep an eye out to make sure the website is mobile-friendly.
Overall, make sure to play around in Google Analytics with all the data provided to gain insights about your audience and their behaviors. The data that I have listed is just a small snippet of the variety of data that is generated by Google Analytics.


No comments:
Post a Comment