Monday, October 31, 2016

Automated Google Analytics Reports

If your boss or you would like to receive automated reports on a weekly, bi-weekly, monthly, or a customized basis; there is a setting in Google Analytics to send reports automatically on a set time-basis. This setting generates basic or specific-data reports of your choosing, showing statistics on how the platform is doing.

In order to be able to create useful reports, you should take into consideration implementing the ideas mentioned throughout this blog to generate a fair amount of traffic. To set up the automated reports you begin with creating a dashboard by starting to set a custom time period, which could include comparing data to a previous time period.


Once the custom period of reporting has been set, go to your desired data tab that you would like to report on; take note that some graphs and charts cannot be added to your dashboard. Then after you decided what data you want your automated report to include, click on the 'Add to Dashboard' tab that is under most of the headings as seen in the image below. 


If it is your first time creating a report of this type, then you will need to choose the option of creating a new dashboard, name it, and choose what you want your report to include, like timelines, tables or charts. This will create a private and personal dashboard which could then be e-mailed to the people of your choosing on a set frequency and day of the week. In addition, if you go into the advanced options tab, you can specify for how long you want this specific report to be sent out to the person, ranging from 1 month to 12 months. After this, you are set on your automated reports and it will be sent out on the frequency and day of the week of your choosing for the set time period.


Monday, October 24, 2016

Google Analytics Certification

As I have reiterated many times throughout this blog, Google Analytics is an important free tool to have in your skill toolbox to make yourself standout in the hiring pool of candidates. With this blog I have taken you on a journey of introducing the world of Google Analytics and providing informative insights on integrating it into business platforms. Ultimately helping to lead you towards a Google Analytics Certification, just like I have acquired.


However, the Google Analytics certification will not be passed without study materials, but Google has provided the public with the Analytics Academy. This online academy provides free training from Google, and it is in their best interest to see you succeed. It may seem demanding at first, and will require a lot of time, dedication, and effort from you, which in the end will be worth it because it will make you stand out from the crowd. You might want to take the free test first and familiarize with the questions and how much you know about Google Analytics, and then pace yourself through study materials and practice on Google Analytics; until you are ready to take the test again.

If you have been following the blog, you should be able to generate some traffic on your platform to get some real life practice. I will continue to provide insights on different reporting that can be done on Google Analytics, which could help to alleviate roadblocks you might run into.

Tuesday, October 18, 2016

eCommerce Analytics : Gumroad

If you have been following along in the blog, I have talked about using Shopify and Google Adwords to learn about analytics with a live platform and ad campaigns. There is another platform, which is free and easy to use as a starting point if you are beginning to learn the basics of analytics, called Gumroad.
Even though you do not have the ability to do conversion tracking from specific ads on Gumroad, you can get a sense of basic analytics. Gumroad will generate data on how many people visited the site, and how many people that visited the site actually purchased an item. However, it will not provide information if the visitors were generated from an ad, or if a certain advertisement was better than another. This is one of the trade offs of using a free tool, because you have to infer on what's going on from the limited insights that are provided as data is generated. There is an option to connect the foundation of Google Analytics to Gumroad, which will provide more in depth insights to aid in more accurate inferences about audience behavior. However, don't forget to go back to the basics of generating traffic through advertisements on social media or using Google Adwords. It is the same concept for Gumroad as it is for Google Analtyics; for a tool to produce data, traffic needs to be generated.


Overall, I want you to understand that learning even the basics of analytics can help you make an advertising campaign more effective and efficient, which is valuable for a business and tracking their return on investment. Thus, analytics can improve spending decisions for advertising budgets to generate greater revenue through more effective ads, and aid your career.

Sunday, October 9, 2016

eCommerce Analytics : Adwords

Now that you know the importance of tracking how effective is the money spent on a particular ad, in terms of making you money with Shopify. It is important to look into a tool called Google Adwords to combine with Google Analtytics and Shopify. These three tools combined make up the perfect trio to capture the full life cycle of analytics and allows you to take a closer look at your return on investment.


In this trio, Shopify provides the foundation for you to create a successful eCommerce site through connecting directly to analytics. Then, Google Analytics tracks the behavior of consumers on your shopping site for ordinary analytics, that I have mentioned throughout this blog. While Adwords, creates the ability to track conversions through providing a way to advertise a site and track how much money you are exactly making from the money spent on ads.


So how does Adwords work? Adwords uses a conversion code which creates a link between the ad and the site. For example, a person sees your ad and is directed to your site when they click on it. Then, the user decides to buy your product and is greeted with an order confirmation page. This prompts Google to mark this purchase as a successful conversion because the specific click on the ad resulted in a purchase. Thus, Google Adwords visually presents how much revenue you made on your eCommerce site for spending the x-amount of money on Google. Take note, people clicking on your ad does not mean they are going to buy your product. Google will charge you because their job was to direct visitors to your site, it is your job to get people to buy your products.

Tuesday, October 4, 2016

eCommerce Analytics : Shopify


Let's take a break away from Google Analytics, in order to look at other ways to track the success of your platform. I have briefly talked about the return on investments in my first post in Introduction to Google Analytics, but I believe that I did not put enough emphasis on the importance of tracking it. Tracking ROI is an important skill to have for anyone who wants to make money, which is the core of Google's success. The best way to track ROI is by being able to do conversion tracking, which means you can tell exactly how effective is the money spent on a particular ad in terms of making you money.


One of the best ways to learn how to track ROI with analytics is through a real eCommerce system, in which I would recommend to set up a Shopify account. Unfortunately, to fully test out the performance of your ads you will need to make the website live, which will require you to spend at least $30 per month for a basic plan. However, what sets Shopify apart from other tools is its ability to work with Google Adwords for conversion tracking; that is essential to helping you make money and begin tracking your return on investment. Shopify allows you to set up a fully functional eCommerce site and accept payments without the need of a web developer. Using this tool is beneficial for people whose platform is to sell digital products, physical products, or to use it as a learning curve to gain experience. If you haven't gotten enough of Google Analytics, after getting started and signing up for a Shopify account you can connect your storefront to your Google Analytics account. This will give you the benefits of gathering ordinary analytics, such as behavior and number of visitors, to parallel data from conversion tracking.

Overall, I wanted to put an emphasis on the importance of understanding the concept of return on investment because you will be helping yourself and your employer to maintain a sustainable online marketing environment. You will be able to measure your success and effectiveness in making money by tracking your return on investment, which is an invaluable skill to any businesses success.


Monday, September 26, 2016

Reviewing Performance in Google Analytics

With your Google Analytics account set up, and assuming you took actions to begin generating traffic on your platform to track visitors; you should have data to analyze the performance of your platform. I have shown you in How to Get Started with Google Analytics how the Audience Overview in Google Analytics should look like with populated results.

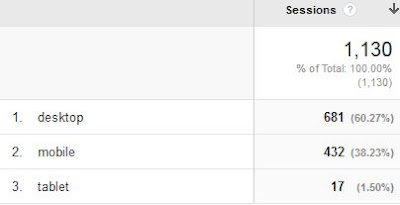
I have been analyzing performance results from RGB Exchange and it is amazing to see how many different performance factors are tracked by a free tool from Google. I am able to track the basic information on the number of sessions, users, page views, bounce rates, etc., which give an overview on how well the website is performing. In addition, I am able to track the users demographics such as their age, gender, language, and country which help to determine the audience the website should be directed towards. I am also able to track the device platform on which the website is accessed from, as seen in the picture below; which help to bring awareness that the majority of the sessions are from desktop computers.


However, an important factor in reviewing performance is to set a date range to get the most relevant information and to track trends. For example, in the picture above the data is from the last 30 days, which gave me an overview of the traffic for the month.While the picture below is data from last week that show a potential trend of an increase in mobile platform usage, bringing awareness to keep an eye out to make sure the website is mobile-friendly.


Overall, make sure to play around in Google Analytics with all the data provided to gain insights about your audience and their behaviors. The data  that I have listed is just a small snippet of the variety of data that is generated by Google Analytics.

Sunday, September 18, 2016

Generating Data for Google Analytics

If you haven't taken actions to promote traffic for your choice of platform, I would advise to begin immediately; in order for Google Analytics to produce data, traffic needs to be generated. One of the easiest and quickest ways to generate traffic is through posting an invitation link of your website or mobile app on social media accounts you already use, such as LinkedIn, Facebook, Twitter, etc. If you want to direct traffic to a specific area of your platform, make sure to promote a link that will lead directly to the desired area instead of the main page of your platform.

However, free social media promotion has become harder due to filters on personal accounts and the evolvement of online advertising. Personal social advertising has become almost parallel to professional social advertising; to which you have to sometimes pay to get exposure. Taking Facebook as an example, many posts are filtered on news feeds which could prevent your personal post from being seen by all of your friends. This is where Facebook created options for ad campaigns as well as promotions for your posts with the links you share to the public, through paying Facebook to promote your posts. Take warning though, whenever you pay Facebook to promote your platform, it will let the readers know the post is sponsored or if it is an advertisement.

Overall, make sure to study and learn your social media outlets for opportunities for free or paid self promotion. In addition, with your shared posts make sure to include visual previews, because pictures get more attention leading to more traffic for your platform, and more data for Google Analytics. Thus, to build a strong network it takes a great investment of time, money, and patience to create a mass interest of retention and the following of users.