In order to be able to create useful reports, you should take into consideration implementing the ideas mentioned throughout this blog to generate a fair amount of traffic. To set up the automated reports you begin with creating a dashboard by starting to set a custom time period, which could include comparing data to a previous time period.

Once the custom period of reporting has been set, go to your desired data tab that you would like to report on; take note that some graphs and charts cannot be added to your dashboard. Then after you decided what data you want your automated report to include, click on the 'Add to Dashboard' tab that is under most of the headings as seen in the image below.

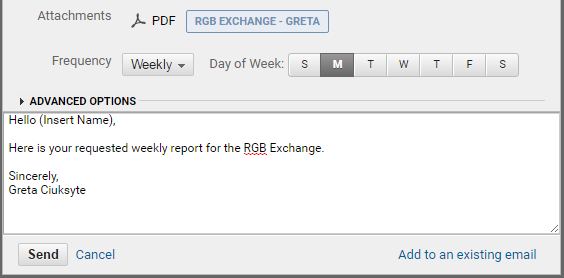
If it is your first time creating a report of this type, then you will need to choose the option of creating a new dashboard, name it, and choose what you want your report to include, like timelines, tables or charts. This will create a private and personal dashboard which could then be e-mailed to the people of your choosing on a set frequency and day of the week. In addition, if you go into the advanced options tab, you can specify for how long you want this specific report to be sent out to the person, ranging from 1 month to 12 months. After this, you are set on your automated reports and it will be sent out on the frequency and day of the week of your choosing for the set time period.